Trends
Why Use an Omnichannel & do you Really Need One?
Whether or not you decide to use an omnichannel solution for your business is entirely up to you. Depending on a business’ needs and wants it may


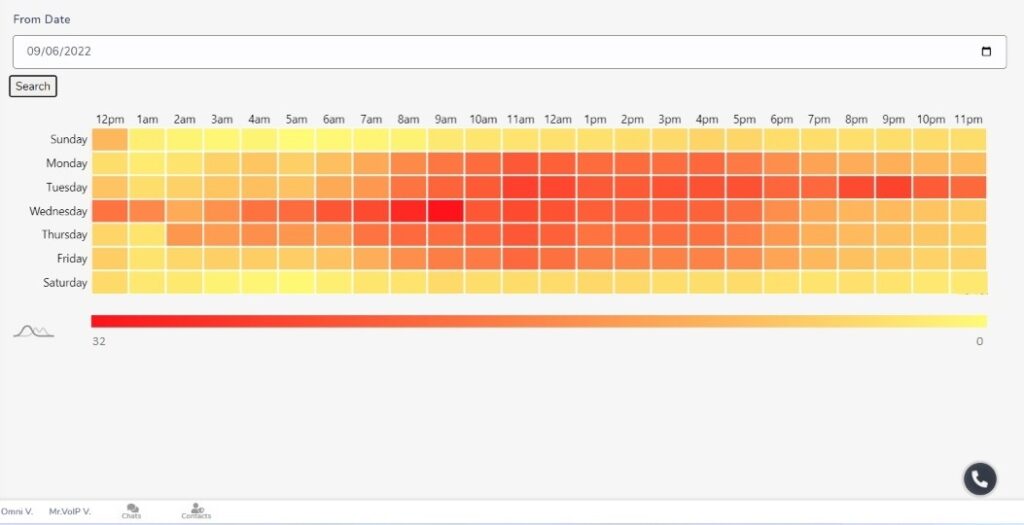
To generate the report simply:
The report will be generated for 7 days from the date of selection (e.g.: If you select 14-03-2023, the report will be generated up until 20-03-2023).

Whether or not you decide to use an omnichannel solution for your business is entirely up to you. Depending on a business’ needs and wants it may

mConnect’s omnichannel is now fully compatible with 3CX V20. With V20 being released less than 2 weeks ago, our team at mConnect has worked super hard to

AI is slowly appearing in all aspects of our day-to-day lives. Call centers use it in an effort to save agents’ time and help customers